|
Historic Redlining in San Diego
November/December 2020
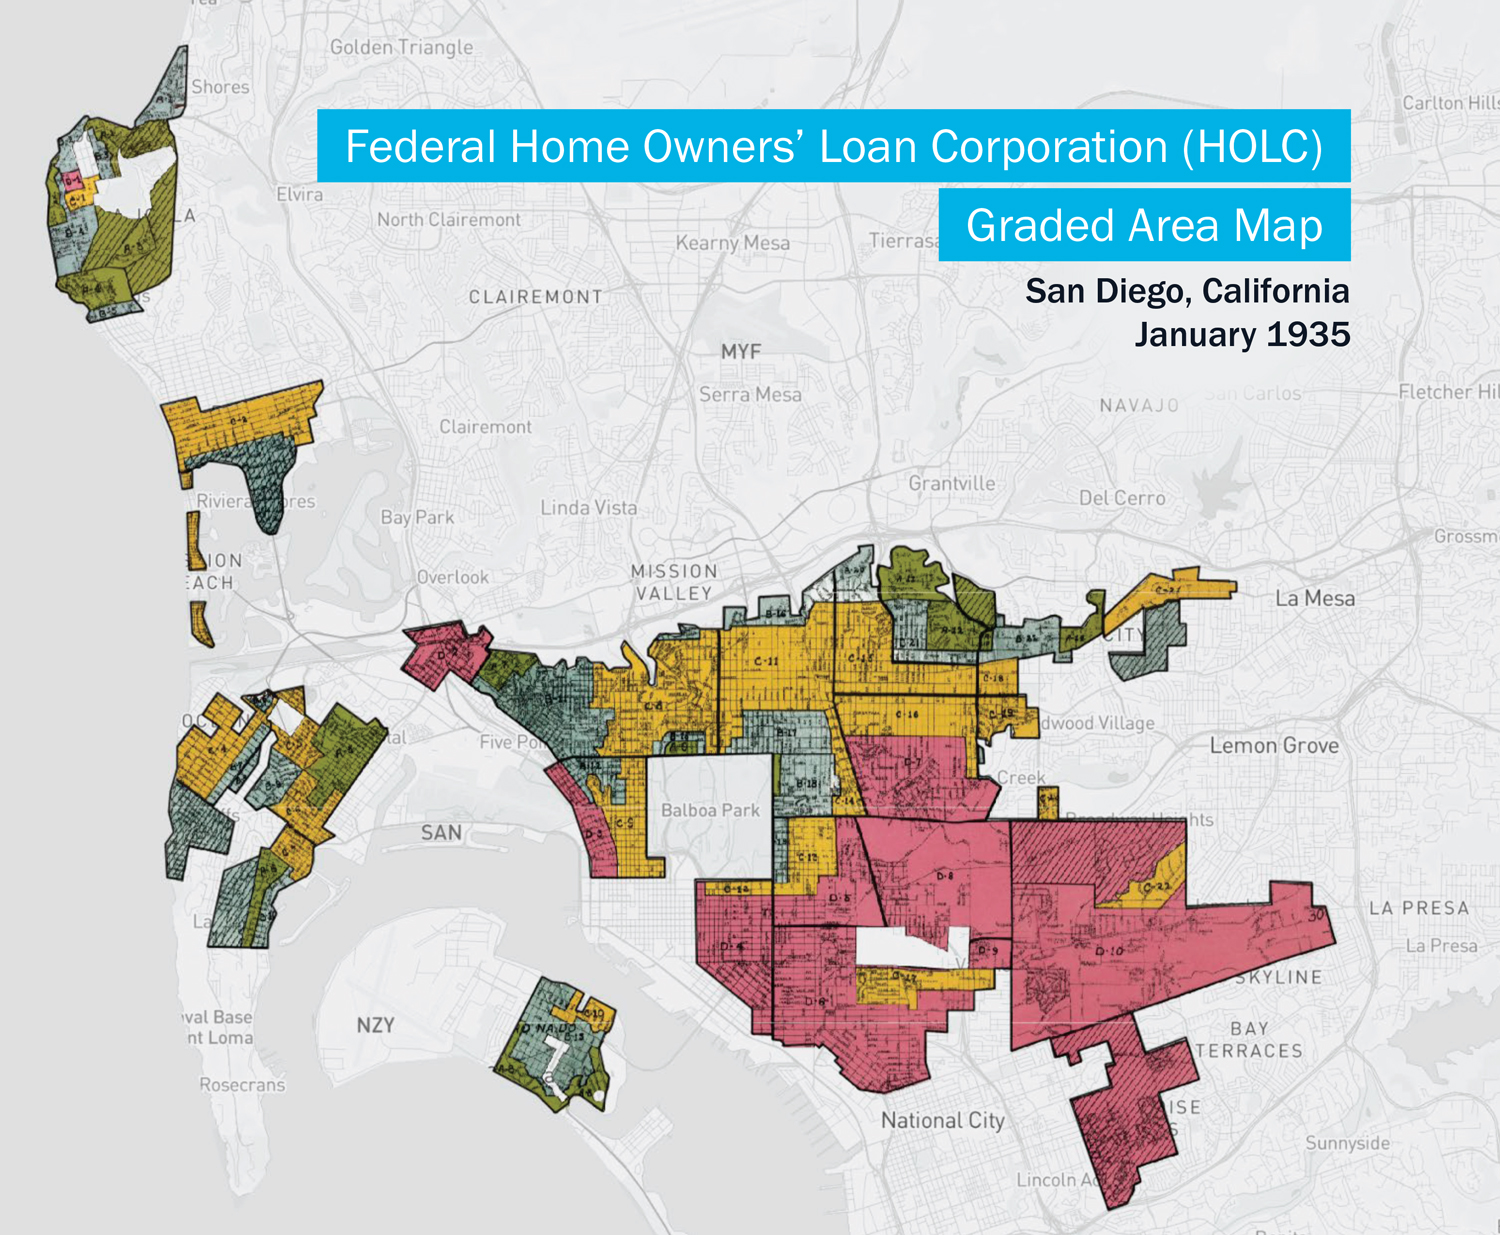
 San Diego redlining map from 1935, courtesy "Mapping Inequality: San Diego Redlining" |
San Diego's Local Initiatives Support Corporation (LISC) recently published a collection of San Diego community maps from a larger digitization project called "Mapping Inequality: Redlining in New Deal America."
Using gradient colors to express the Federal Home Owners Loan Corporation (HOLC) "risk grades," the coloring of these neighborhood maps reflects the mortgage lendable areas, A through D, as determined by HOLC income levels, race and/or ethnicity, and housing/land use types factored into the grades. As LISC candidly states, "More often than not, C- and D-graded areas were where Brown and Black people and immigrants called home," which is not where banks were willing to lend, hence the practice of redlining. The 1935 map with this article bleeds red south of Interstate 8.
Check out this important collection of maps, which explains in visual detail how redlining occurred in San Diego, through HOLC, an endorsed federal government program. LISC poses many important and timely questions for us to ask ourselves as we analyze these difficult aspects of our shared history, including, "What has changed? What has stayed the same? [And] Why?"
Four universities are collaborating on "Mapping Inequality: Redlining in New Deal America." [add pd] For more info on this larger project, see HERE.
|